– News and analysis covered by Quincy Quarry News
Quincy found not so safe per a review of nationwide crime statistics.
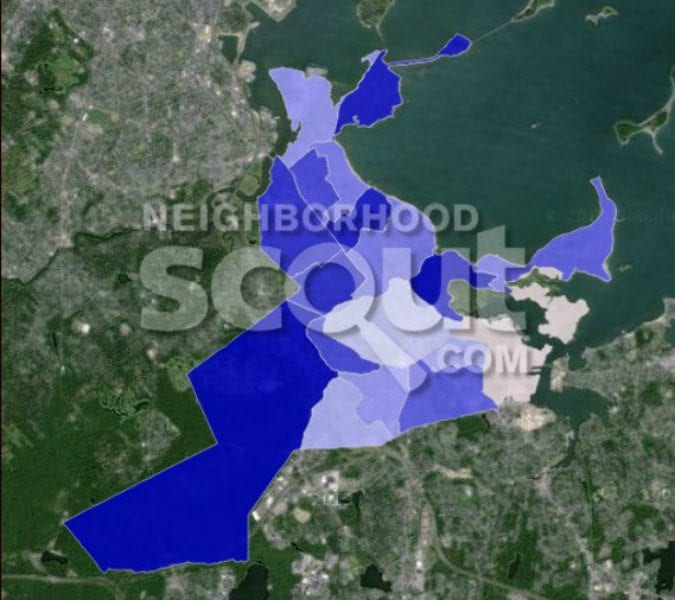
Overall, crime rates nationally have trended downward over the past few decades. They have also done so locally, just not as much so. In turn, such is at the heart of why Quincy measures up as less safe than 64% of cities nationwide.
The underling factors are complex and worthy of a lengthy as well as whole other discussion at another time.
As it is, this particular study’s findings offer up both some confusion as well as quotes that one could cherry pick to use to spin things one way or the other as regards crime rates in Quincy.
For example, ponder the following and arguably confusing passage from the study:
“The crime rate in Quincy is considerably higher than the national average across all communities in America from the largest to the smallest, although at 20 crimes per one thousand residents, it is not among the communities with the very highest crime rate. The chance of becoming a victim of either violent or property crime in Quincy is 1 in 50. Based on FBI crime data, Quincy is not one of the safest communities in America. Relative to Massachusetts, Quincy has a crime rate that is higher than 80% of the state’s cities and towns of all sizes.”
“However, compared to other communities of similar population size, Quincy has a crime rate that is noticeably lower than the average. This means that for comparably sized cities all across America, Quincy is actually safer than most according to NeighborhoodScout’s exclusive analysis of FBI crime data.”
Diagram or otherwise parse the points noted above, however, and the various statements are not contradictory given that that different points of comparison made within the passage give rise to different – but still valid – findings as they are the results of perfectly legitimate different looks at the data rather trying to force outcomes that support an agenda.
In this instance, one way to explain the seeming incongruous above cited passages, note that the thirteen largest cities ranked by population are Boston, Worcester, Springfield, Lowell, Cambridge, New Bedford, Brockton, Quincy, Lynn, Fall River, Newton, Lawrence and Somerville.
In turn, excluding Boston as an outsized outlier, Quincy ranks as fourth after Newton, Somerville, and Cambridge as Massachusetts cities with the lowest likelihood of being the victim of a violent crime, with Quincy only barely nosing out fifth ranked Lowell.
To see tables laying out the above city comparisons, click here
In short, and again, it is the way comparisons were made which makes the above cited passage appear at odds with itself when in point of fact it is not.
As such, given the potential for confusion as addressed above as well as that the number of crimes vary both from year to year as well as from category to category across communities nationwide, arguably the best way to look at crime statistics is over time so as to endeavor to spot any trends.
In the case of Quincy, the incidence of crime has declined over the past few decades and this is a good thing.
The problem, however, is that the decline in the incidence of crimes in Quincy has tended to lag behind the rate of decline nationally.
As such, the key is not that crime rates have generally declined in recent years, but rather the rates of decline of crime in Quincy over time as compared with other points of comparison – national statistics, statewide data, peer communities and the like.
Read Full Story: Quincy Crime Rates


QuincyQuarry.com
Quincy News, news about Quincy, MA - Breaking News - Opinion
No more posts